Question 1 of 10
The Hardy-Weinberg principle states that allele frequencies remain constant when:
Amutations are common
Bthere is no evolution occurring
Cnatural selection is strong
Dthe population is very small
Explanation
📌 Conditions: no mutation, no migration, random mating, large population, no natural selection.
Any violation → evolution occurs.
Any violation → evolution occurs.
Question 2 of 10
Which graph correctly shows exponential growth?
ABoth
BB
CA
DNeither
Explanation
📌 Exponential growth = J-shaped curve (slow start, rapid increase)
Linear growth = straight line (constant rate)
Graph A shows exponential growth.
Linear growth = straight line (constant rate)
Graph A shows exponential growth.
Question 3 of 10
Which organelle is labeled X in the cell diagram below? 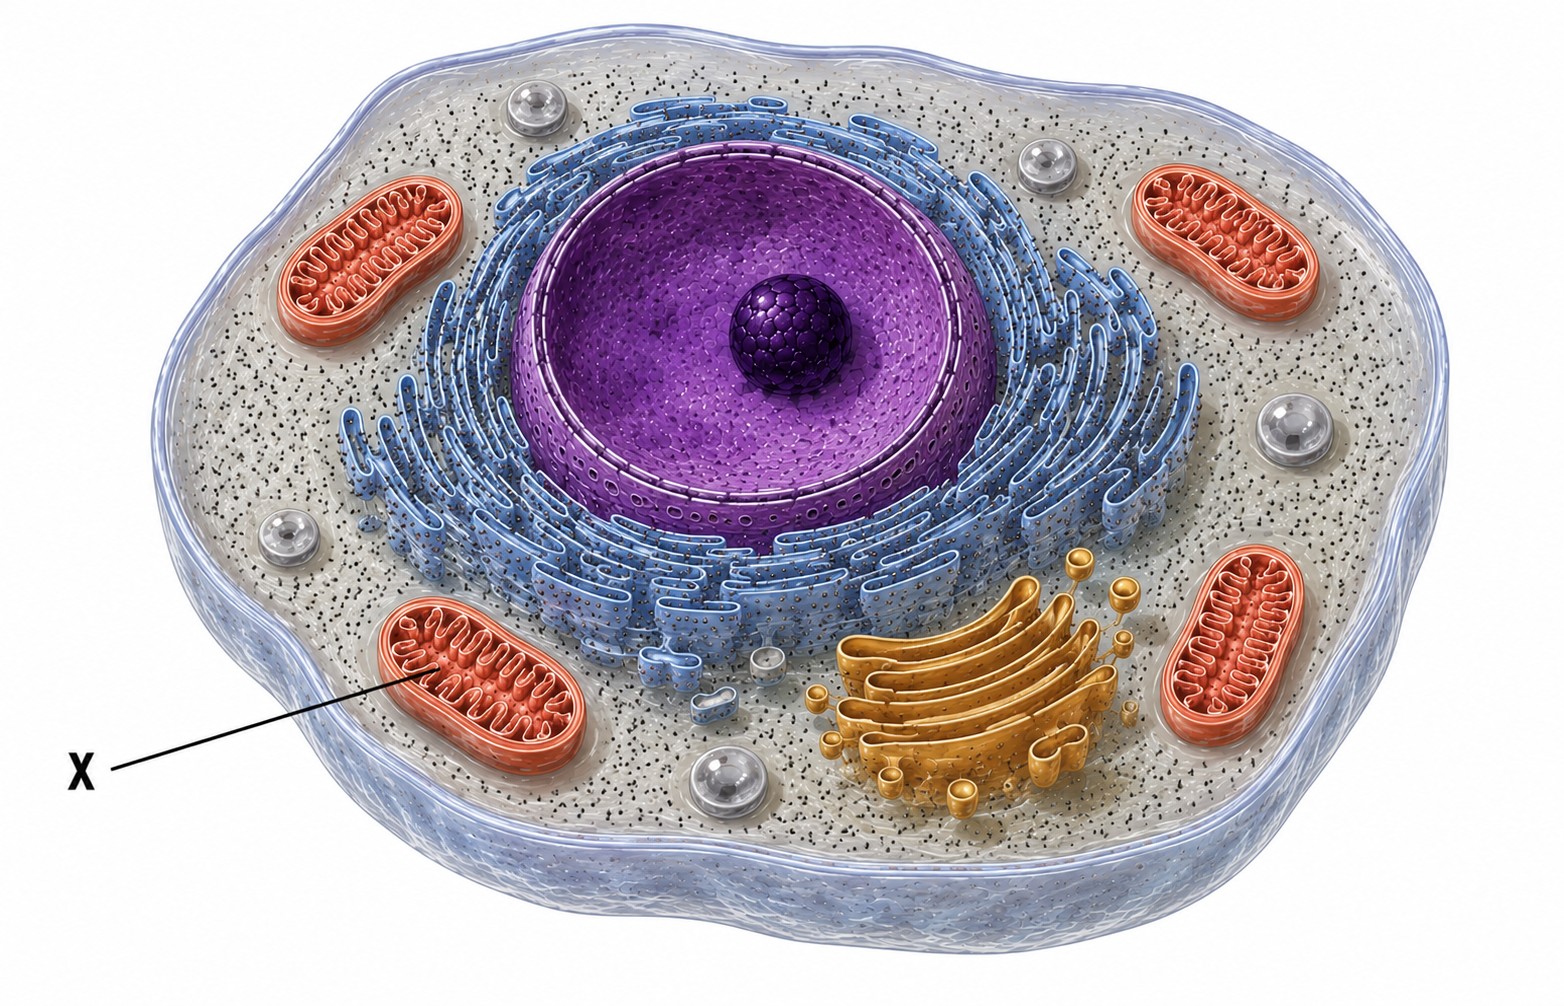
AEndoplasmic reticulum
BMitochondria
CNucleus
DGolgi apparatus
Explanation
📌 Organelle X has the bean-shaped structure with inner folds (cristae) → Mitochondria
Mitochondria = powerhouse of the cell = produces ATP through cellular respiration
C₆H₁₂O₆ + 6O₂ → 6CO₂ + 6H₂O + ATP
Mitochondria = powerhouse of the cell = produces ATP through cellular respiration
C₆H₁₂O₆ + 6O₂ → 6CO₂ + 6H₂O + ATP
Question 4 of 10
The graph shows the change in a moth population over time. Dark moths increased after industrial pollution darkened tree bark. This is an example of:
ANatural selection
BArtificial selection
CSpontaneous generation
DGenetic engineering
Explanation
📌 This is the classic peppered moth example of natural selection.
Before pollution: light bark → light moths camouflaged → survived
After pollution: dark bark → dark moths camouflaged → survived
The environment selected for the trait that provided camouflage.
Before pollution: light bark → light moths camouflaged → survived
After pollution: dark bark → dark moths camouflaged → survived
The environment selected for the trait that provided camouflage.
Question 5 of 10
In a DNA nucleotide, which component carries the genetic code through its specific sequence?
AHydrogen bond
BPhosphate group
CDeoxyribose sugar
DNitrogenous base
Explanation
The nitrogenous base (adenine, thymine, guanine, or cytosine) is the part of a DNA nucleotide that varies — its sequence along the strand IS the genetic code. The phosphate and deoxyribose sugar are identical in every nucleotide and form the structural 'backbone' of the DNA strand; they don't store information. Hydrogen bonds hold the two strands together at the bases but are not part of a single nucleotide.
Question 6 of 10
A theory in science is:
Aan untested guess
Bthe same as a hypothesis
Ca proven fact that can never change
Da well-supported explanation based on extensive evidence
Explanation
📌 A scientific theory is well-tested, widely accepted, and explains a broad range of observations.
It is NOT just a guess — that's a hypothesis.
It is NOT just a guess — that's a hypothesis.
Question 7 of 10
A student designed an experiment to test how light affects plant growth. Identify the components of this experiment. 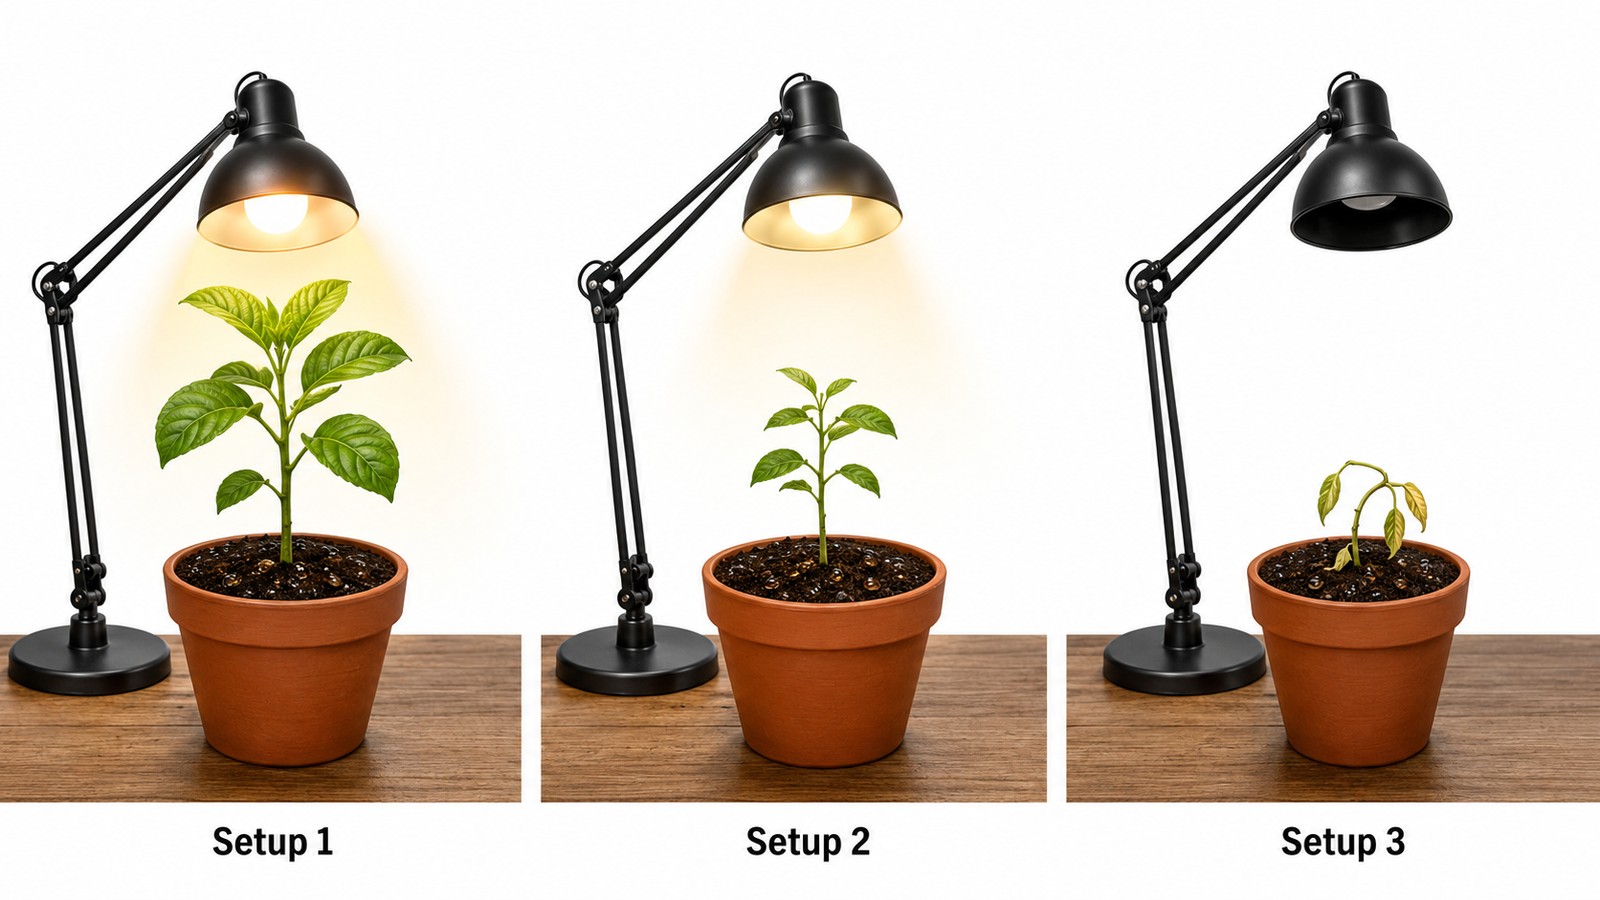
AIndependent: plant height; Dependent: light
BIndependent: water; Dependent: soil
CIndependent: light; Dependent: plant height
DIndependent: temperature; Dependent: light
Explanation
📌 Independent variable = what you change (light)
Dependent variable = what you measure (plant height)
Control group = no light (to compare against)
Constants = same soil, water, temperature, pot size
Dependent variable = what you measure (plant height)
Control group = no light (to compare against)
Constants = same soil, water, temperature, pot size
Question 8 of 10
During which phase of the cell cycle does DNA replication occur? 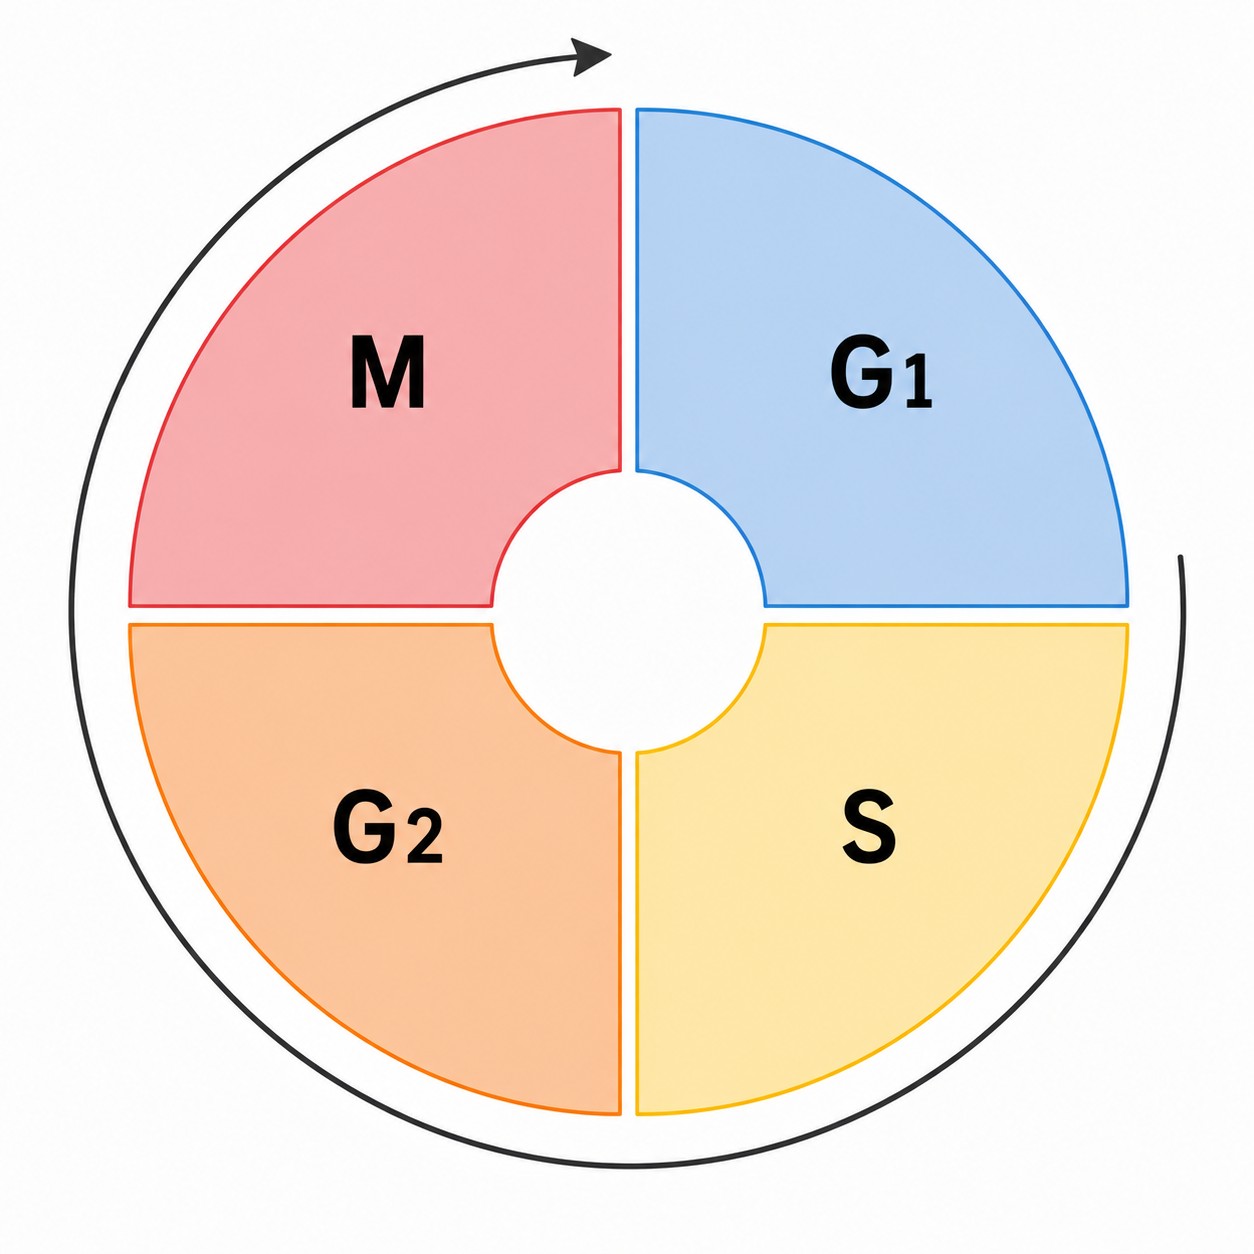
AG1 phase
BS phase
CM phase
DG2 phase
Explanation
📌 DNA replication occurs during S phase (Synthesis) of interphase.
Interphase: G1 → S → G2, then Mitosis.
Interphase: G1 → S → G2, then Mitosis.
Question 9 of 10
All three domains of life (Bacteria, Archaea, and Eukarya) share which structural feature?
AA membrane-bound nucleus
BRibosomes for protein synthesis
CMulticellular organization
DChloroplasts for photosynthesis
Explanation
All cellular life — Bacteria, Archaea, and Eukarya — uses ribosomes to build proteins. Distractors: a membrane-bound nucleus is found only in Eukarya (Bacteria and Archaea are prokaryotic). Multicellularity appears only in some Eukarya — most life is unicellular. Chloroplasts are organelles found only in plants and algae (a subset of Eukarya).
Question 10 of 10
Which molecule carries energy from glucose breakdown to the electron transport chain?
AH2O
BCO2
CATP
DNADH
Explanation
📌 NADH and FADH2 are electron carriers. They transport high-energy electrons from glycolysis and Krebs cycle to the ETC.